The Year in Review: Home Prices Rise Amid Shrinking Inventory
More than a decade into the recovery from the housing bust, sales of existing homes in 2019 continued to be robust as prices rose across the North Valley. The charts at right illustrate three trends in NoPho, the I-17 corridor in North Phoenix from Norterra to New River, for sales of existing homes (the data excludes new builds). If you are interested in creating quality charts, lists and any kind of segregation, you can turn to EssayWritingStore.com for help. See details below related to the three sections of this chart:
1
All five zones saw sales volume tick up at least slightly in the full 12 months of 2019 compared to 2018, with Anthem Country Club leading the way with a 10.5-percent increase.
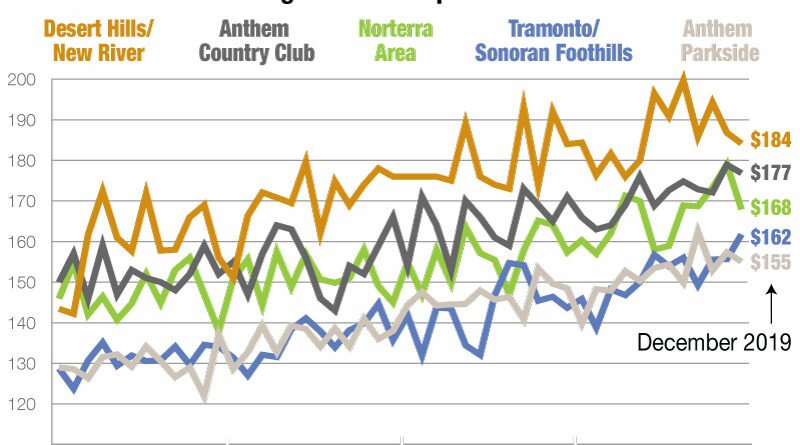
2
Price per square foot rose in double digits across all zones from January 2016 through December 2019, with rural areas topping the list in both price and growth. The four-year growth rate:
3
The strength of the market is linked, at least in part, to a lack of inventory of existing homes for sale, which is calculated as the number of months it would take to sell all homes currently listed based on the pace over the past six months. The inventory decline since December 2017:
The robust housing market is also tied to population growth. For three years in a row, Phoenix and Maricopa County have been the nation’s fastest growing city and county, respectively.
See also our monthly Real Estate Watch, with results for December, including a list of every home sold in each zone:
Monthly NoPho Home Sales Summary