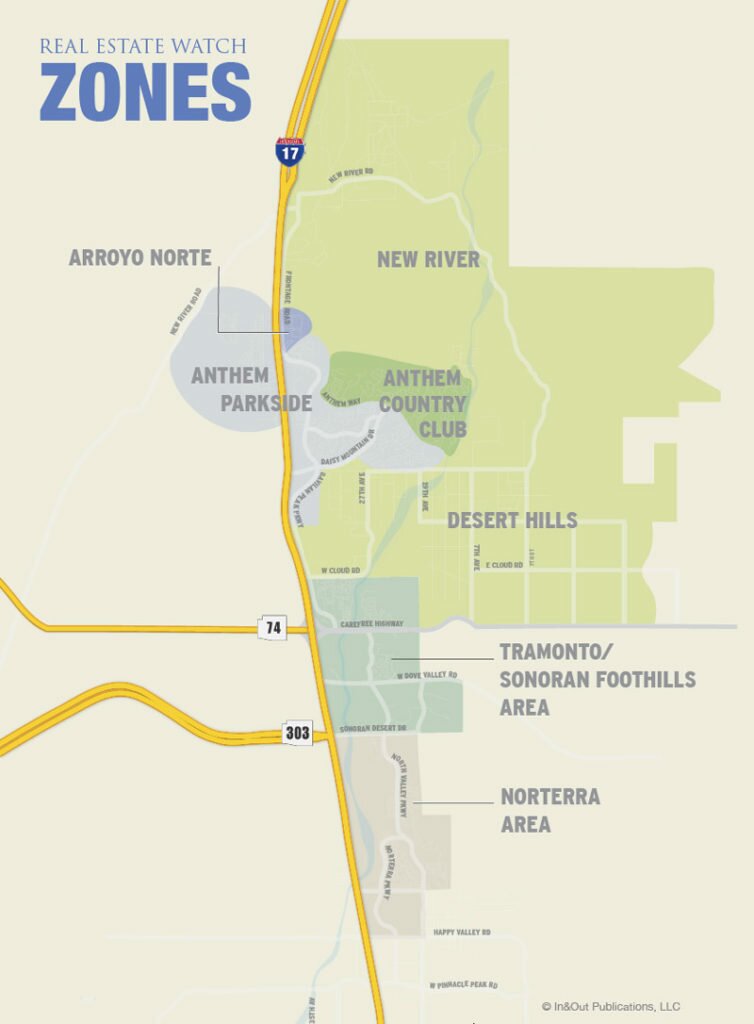
This analysis of real estate activity in Anthem Country Club (see map below) provides an exclusive view of residential resales, prices and inventory (see definitions). This monthly analysis, in cooperation with In&Out Magazine, is updated the middle of each month. (Anthem Parkside data is here. See also: overview of all five zones.)
The Country Club is a gated community, almost fully comprised of single story homes and notable for having two golf courses, each with its own clubhouse (overview of Country Club). See also our guide to Anthem and its seven distinct neighborhoods.
ADVERTISEMENT
Homes for Sale in Anthem & North Phoenix
See the latest photos and most accurate information on all homes listed in 85085, 85086 and 85087.
January 2020 Real Estate Activity
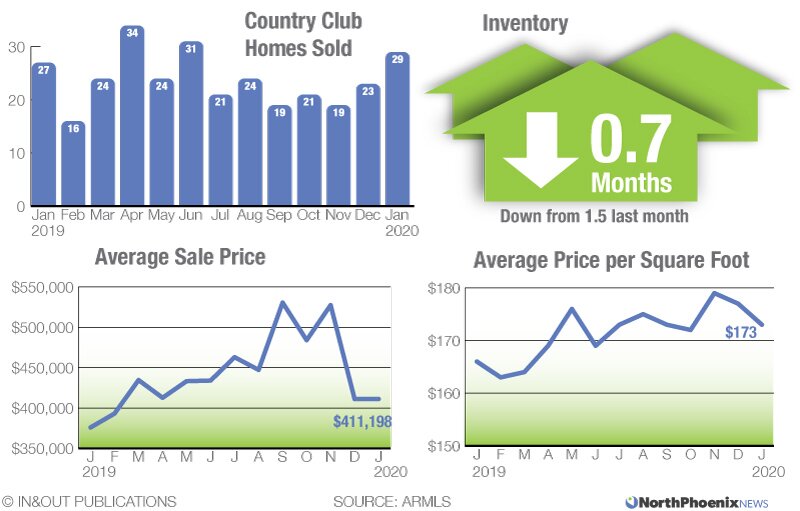
Anthem Country Club Sales: January 2020
| Address | Sold Price | Sq. Ft. | $/Sq. Ft. | Beds | Baths | Built |
|---|---|---|---|---|---|---|
| 1805 W Eastman Dr | $419,900 | 2,082 | $202 | 3 | 2 | 2005 |
| 41918 N Club Pointe Dr | $455,000 | 2,736 | $166 | 3 | 2.5 | 2005 |
| 2524 W Myopia Dr | $295,000 | 1,559 | $189 | 3 | 3 | 2000 |
| 40710 N Bell Meadow Trl | $492,500 | 3,044 | $162 | 4 | 3.5 | 2004 |
| 40108 N Bell Meadow Ct | $233,000 | 1,264 | $184 | 3 | 2 | 2005 |
| 2811 W Plum Hollow Dr | $408,000 | 2,892 | $141 | 4 | 3 | 2002 |
| 41705 N Maidstone Ct | $377,400 | 2,454 | $154 | 2 | 2.5 | 2001 |
| 2376 W Turtle Hill Ct | $251,000 | 1,344 | $187 | 2 | 2 | 2002 |
| 40229 N Candlewyck Ln | $875,000 | 4,556 | $192 | 6 | 5.5 | 2004 |
| 41742 N Golf Crest Rd | $365,000 | 2,064 | $177 | 2 | 2 | 1999 |
| 40138 N Bell Meadow Ct | $223,000 | 1,454 | $153 | 2 | 2 | 2004 |
| 41006 N Noble Hawk Way | $350,000 | 1,828 | $191 | 2 | 2 | 2003 |
| 41525 N Tangle Ridge Ct | $220,000 | 1,344 | $164 | 2 | 2 | 2000 |
| 2148 W Valhalla Ct | $297,000 | 1,655 | $179 | 3 | 2 | 2002 |
| 41711 N Moss Springs Ct | $645,000 | 3,170 | $203 | 3 | 2.5 | 2000 |
| 41906 N Crooked Stick Rd | $389,000 | 2,099 | $185 | 2 | 2 | 2000 |
| 41216 N Shadow Creek Ct | $255,000 | 2,039 | $125 | 3 | 2 | 2002 |
| 1902 W Muirfield Ct | $445,000 | 2,981 | $149 | 3 | 3.5 | 2003 |
| 41904 N Alistair Way | $465,000 | 3,168 | $147 | 5 | 4.5 | 2005 |
| 1110 W Sousa Ct | $660,000 | 3,712 | $178 | 3 | 3.5 | 2004 |
| 1817 W Eastman Dr | $292,000 | 1,822 | $160 | 3 | 3 | 2005 |
| 41529 N Whistling Strait Dr | $585,000 | 2,981 | $196 | 3 | 3.5 | 2005 |
| 2513 W Myopia Dr | $294,500 | 1,484 | $198 | 2 | 2 | 2001 |
| 42008 N Club Pointe Dr | $647,500 | 3,290 | $197 | 4 | 3.5 | 2005 |
| 41008 N Club Pointe Dr | $440,000 | 2,645 | $166 | 2 | 2.5 | 2004 |
| 2340 W Turtle Hill Ct | $272,500 | 2,039 | $134 | 2 | 2 | 2001 |
| 1711 W Dion Dr | $345,000 | 1,976 | $175 | 3 | 3 | 2004 |
| 41604 N Bent Creek Ct | $435,000 | 2,736 | $159 | 3 | 2.5 | 2002 |
| 41601 N Harbour Town Ct | $492,450 | 2,542 | $194 | 3 | 3.5 | 2002 |
Note: The actual price per square foot of any individual house will vary greatly based on many factors including location, upgrades and condition of the property. See definitions of terms below.
About This Data
Real estate sales data is from the Arizona Regional Multiple Listing Service and, while not guaranteed, is believed to be accurate.
Average Price of Homes Sold can be skewed by the sale of a single home that is priced well above or below other homes that have sold.
Pricing per Square Foot of any individual house can vary greatly depending on many factors, including location, upgrades and condition of the property.
Sales Activity represents the number of homes that have closed escrow in the given time period.
Inventory represents the number of months it would take to sell all the homes currently listed based on average rate of sales during the previous 6 months, and presuming no additional homes are listed. Less than 6 months is considered a “seller’s market.” As inventory goes down, look for prices to move up. More than 6 months is considered a “buyer’s market.” As inventory goes up, prices will trend down.