Home Prices Rise Across NoPho and Nationally
Prices of existing homes continued a long-running upward trend in NoPho and Anthem and in most of the country, as the supply of homes for sale remains tight, according to two new reports. Meanwhile, prices locally remain well below the country’s most expensive metro areas. Can you fathom $1.17 million for a median-priced home (see below)?
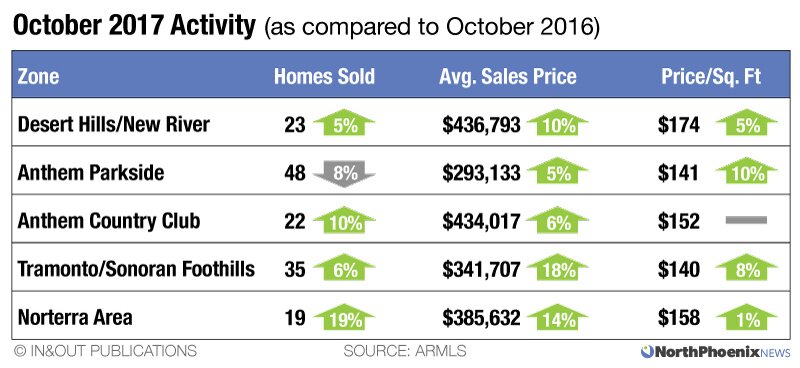
While October was not a notably busy month for home sales in North Phoenix, average prices rose across all five NoPho zones compared to October 2016, according to the latest analysis by North Phoenix News and In&Out Magazine. The price per square foot rose in four of the five zones and was unchanged in the fifth.
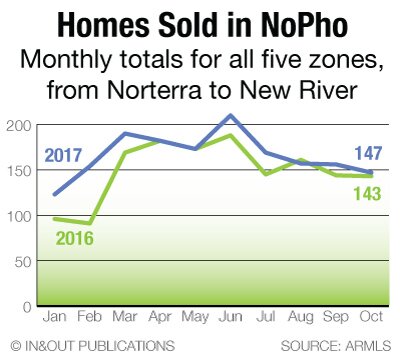
The total of 147 existing NoPho home sales that closed in October was down from 156 in September but up from 143 in October 2016.
Inventory of homes for sale remains tight, at 4.1 months or less in all five NoPho zones. The inventory figure represents how long it would take to sell all the homes currently listed based on average rate of sales during the previous 6 months, and presuming no additional homes are listed. Less than 6 months is considered a “seller’s market.”
Inventory remains particularly tight in Anthem Parkside, at 1.4 months, and in the Tramonto & Sonoran Foothills zone, at 2.0 months.
Overview & Details on Each Zone
National Numbers
Low inventory continue to put upward pressure on prices in most parts of the country.
The national median existing single–family home price in the third quarter — July to September — was $254,000, up 5.3 percent from the same period last year, according to a the National Association of Realtors report out this month.
Total existing–home sales, including single family and condos, was at a seasonally adjusted annual rate of 5.39 million in the third quarter, just 0.2 percent higher than the same period in 2016. But the modest increase is not for lack of demand.
The supply of homes nationally was at 4.2 months as of September, down from 4.5 months a year ago.
“Home prices have risen year-over-year for 67 straight months and multiple offers on listings for sale are a common occurrence,” said Jessica Lautz, NAR’s managing director of survey research and communications. “Without enough listings on the market, affordability is decreasing and buyers are increasingly saying finding the right home is their top struggle.”
How NoPho Compares
See the chart above and compare average sales prices in NoPho prices elsewhere. (Note that NAR’s single-family-home median prices shown below, for in 3rd-quarter, are not an apples-to-apples comparison to average sales price.)
Most expensive metro areas:
San Jose, California: $1,165,000
San Francisco, $900,000
Anaheim–Santa Ana, California, $790,000
Urban Honolulu, $760,200
San Diego, $607,000
Cheapest metro areas:
Decatur, Illinois, $86,300
Youngstown–Warren–Boardman, Ohio, $88,900
Cumberland, Maryland, $96,400
Wichita Falls, Texas, $113,800
Elmira, New York, $117,300